What are the highest frequency patterns in ESU5?
If we turn ESU5 data into a series of coin tosses what patterns repeat the most?
To figure this out I’m collecting a range bar data set on ES futures that’s two contracts old — Old is fancy for complete.
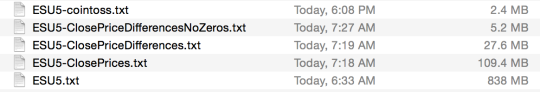
Expect this kind of file size:
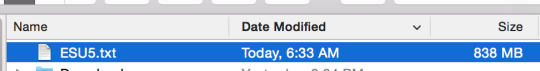
This is small because:
- I didn’t store bid/ask volume – if you did, then you’d be looking at tera(?)bytes worth of data.
- In this case, “Range Bars” will give the same amount of information as tick data.
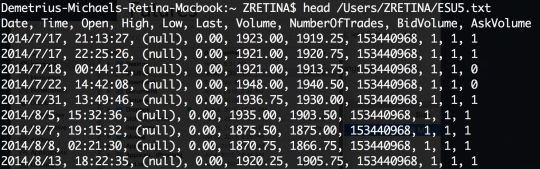
Anyway, this is a snap of my data-set (notice that even w/ 0.25 range bars, the data is crap near the beginning of the stream).
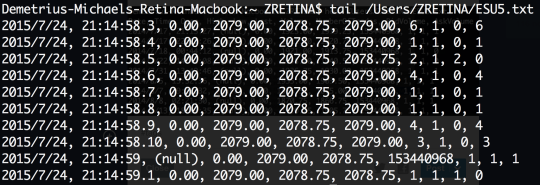
And near the end of the stream, it’s crap too:
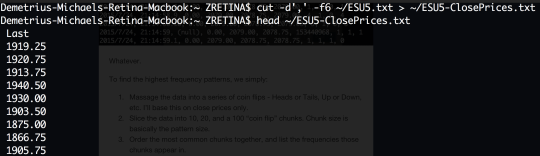
Whatever.
To find the highest frequency patterns, we simply:
- Massage the data into a series of coin flips - Heads or Tails, Up or Down, etc. I’ll base this on close prices only.
- Slice the data into 10, 20, and a 100 “coin flip” chunks. Chunk size is basically the “pattern” size we pre-define.
- Order the most common chunks together, and list the frequencies those chunks appear in.
An alternative is to attempt to find the shortest “non-random” pattern size; but then we’ll have to define what random is!
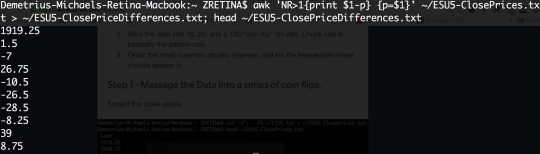
Step 1 - Massage the Data into a series of coin flips.
Extract the close prices
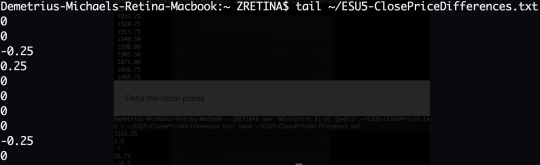
Delta the close prices (Close prices are wild near the beginning due to illiquidity of the contract).
Near the EOF you’ll see something closer to normal:
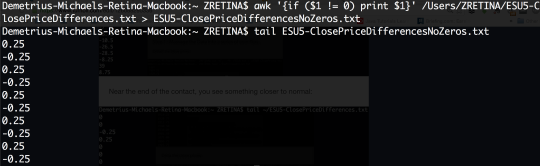
Kill the zeros - We gain a clean yes/no answer this way, but we lose the “no change” answer.
Something to think about: What does the data loss mean to the results?
Negative is up, Positive is down - Perl code brought to you by Kent.

Now we’ve massaged the data into something digestible for visualization:
All of this could’ve been done in one step, but breaking it down this way makes the assumptions horrendously obvious. Here’s the gist if you need the one liners above for something else.
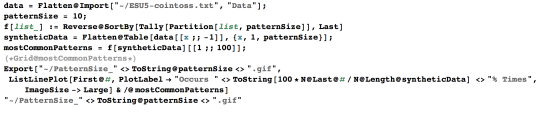
Step 2 - Do everything else.
Now, some simple Mathematica code where we can find the frequency of patterns given the “pattern size”.
Things are how you’d expect them, but I was a bit clever (or stupid) with the dataset, so the results would come out a bit richer:
10 move pattern:
20 move pattern:
100 Move:
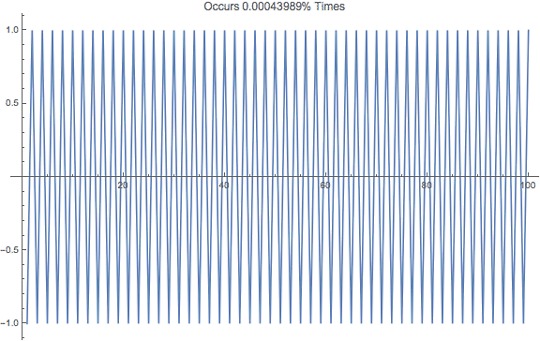
Despite the low frequency, the highest frequently traded pattern is the one that goes up down up down up down ad infinitum. This is why market makers are in business :), with a little bit more math, you could calculate out edge.
Something else to think about: If trade patterns are unique, could we use them as fingerprints of human behaviour?